ENG

Données patrimoniales - Comment les fiabiliser ?

How Can You Ensure the Long-Term Reliability of Your Asset Data?

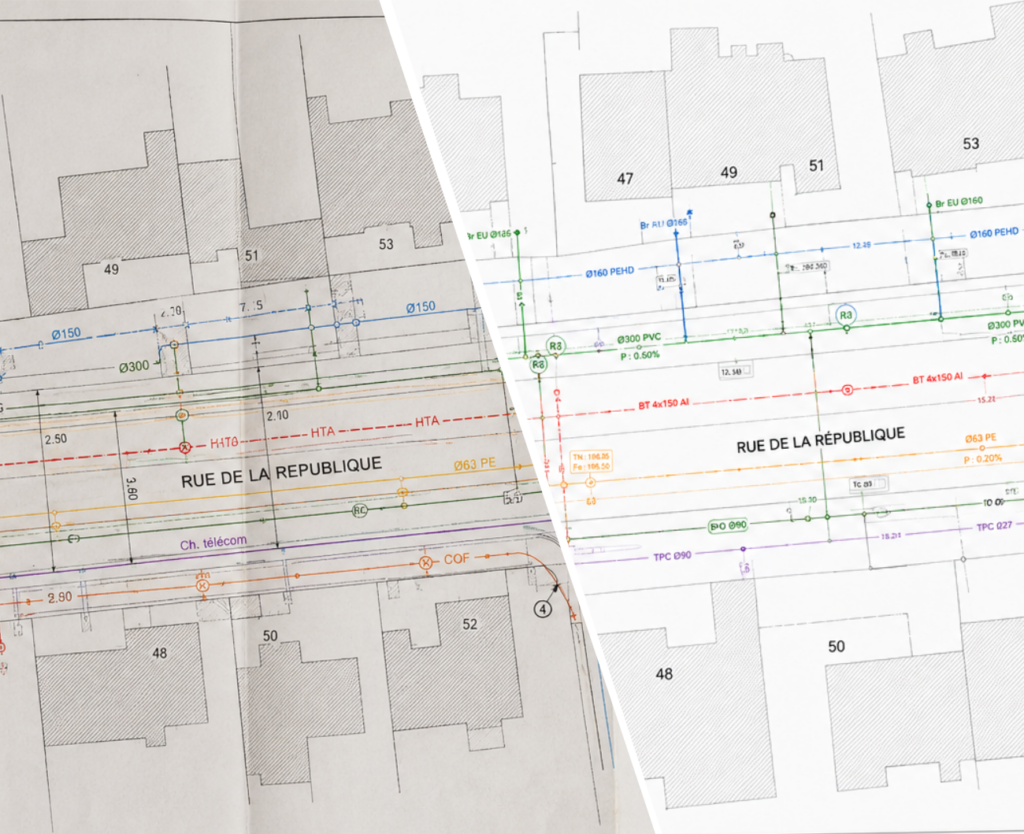
Preserving infrastructure knowledge throughout its lifecycle. Plans, topographic surveys, geographic information system (GIS) data, georeferenced photographs, as-built documentation, technical attributes, intervention histories… As construction and maintenance operations progress, infrastructure generates an increasing amount of data. This information is essential. It tells us where assets are located, how they were built, what changes have been made and under what conditions future interventions can be carried out. But its lifespan extends far beyond that of the project that produced it. Data acquired today may be used several years later, by another team, another service provider or with new tools. In the meantime, the physical assets themselves may also have changed: a network may have been relocated, a road redesigned, equipment replaced or new infrastructure created. This is where the challenge lies: how can reliable and usable knowledge of infrastructure be preserved over time? This challenge concerns all stakeholders who produce, use or transmit infrastructure information: local authorities, utility operators and network managers, contractors and works service providers, engineering firms and surveyors, as well as industrial and sensitive sites. They do not all use data in the same way. Some produce it in the field, others process and transmit it, while others need to use it and keep it up to date over time. But they all depend on the same thing: being able to retrieve reliable information, understand where it comes from and know how far they can trust it. A wealth of data, but knowledge that can become less reliable The problem is not a lack of data. On the contrary, organisations have been accumulating it for years. However, it comes from multiple sources: detection operations, survey campaigns, successive construction projects, as-built plans, maintenance operations, engineering firms, contractors, surveyors, internal departments and utility operators. Methods and tools also evolve. Software changes, information systems migrate, formats succeed one another, and service providers and teams change. Over time, some information is re-entered or moved. Other information is no longer updated. Some data loses its link to the documents or surveys from which it was produced. Other information may simply be lost. Meanwhile, the infrastructure itself continues to evolve. Gradually, a gap can emerge between the actual state of the assets and the knowledge available to document them. Preserving data reliability therefore means not only retaining its context, but also being able to incorporate new information produced during successive interventions so that knowledge of the assets continues to evolve with them. The issue is therefore not simply having data available. It is also being able to determine whether that data accurately reflects reality and whether it can be trusted. When data loses its context, it loses part of its value Imagine a network represented in a GIS. Its position may appear perfectly usable. Yet several years after it was acquired, certain questions become essential: When was this data produced? Which survey was it based on? Which method was used, and with what level of accuracy? Which service provider or team produced it? Which intervention or project version does it correspond to? Are there photographs, surveys or documents that can be used to verify it? If this information is no longer available, it becomes difficult to assess how much confidence can be placed in the data. The consequences are very tangible: document searches, contacting former stakeholders, additional field checks, or even new network detection or location operations. When the available mapping no longer makes it possible to locate an asset with sufficient accuracy, additional investigations or location operations may indeed become necessary. These interventions can represent a significant additional cost for the stakeholders involved, with responsibility for those costs varying depending on the type of investigation and the context in which it is carried out. These costs are compounded by delays, new survey campaigns and, in some cases, decisions made on the basis of information whose reliability remains uncertain. Reliable asset data is therefore not simply accurate data. It is data whose origin, context and history remain understandable over time. This is the core challenge of traceability. Data that must remain reliable from one stakeholder to another Data accompanies infrastructure through different stages of its lifecycle. Uses and responsibilities vary depending on the stakeholders involved, but everyone has an interest in preserving its quality and continuity. For a local authority, the challenge is to build and maintain reliable asset databases despite successive interventions, changes in service providers or changes in teams and departments. This knowledge of utility networks helps prepare future projects, monitor completed works and support planning decisions with reliable, up-to-date information. The challenge today is to ensure that this knowledge, centralised in geographic information systems, remains complete, current and traceable over time. For a utility operator or network manager, the challenge is to maintain reliable, up-to-date knowledge of assets in order to secure interventions, plan works and monitor the evolution of the infrastructure over time. Collecting, structuring and updating field information makes it possible to build an asset database that can be used in GIS and shared between different departments and service providers. For a contractor or works service provider, one of the main challenges is to document field interventions accurately and ensure the continuity of that information through to the office and the project owner. Traceability of interventions, reliable as-built surveys and the sharing of field data make it possible to verify that work has been carried out correctly, limit information gaps and provide reliable documentation for future interventions. For an engineering firm and its surveyors, the challenge is to use data collected in the field efficiently and maintain its reliability through to the production and delivery of final deliverables. Better continuity between the field and the office reduces duplicate data entry and information gaps, facilitates data checking and enables clients to receive accurate, documented and directly usable information. For an industrial or sensitive site, having reliable and up-to-date knowledge of utility networks is directly linked to intervention safety and service continuity. Incomplete or outdated mapping can expose teams to risk,

How Can You Ensure the Long-Term Reliability of Your Asset Data? Read Post »
Coordonnées GPS WGS84, RGF93, Lambert-93, EPSG

Why do your coordinates change from one software program to another?

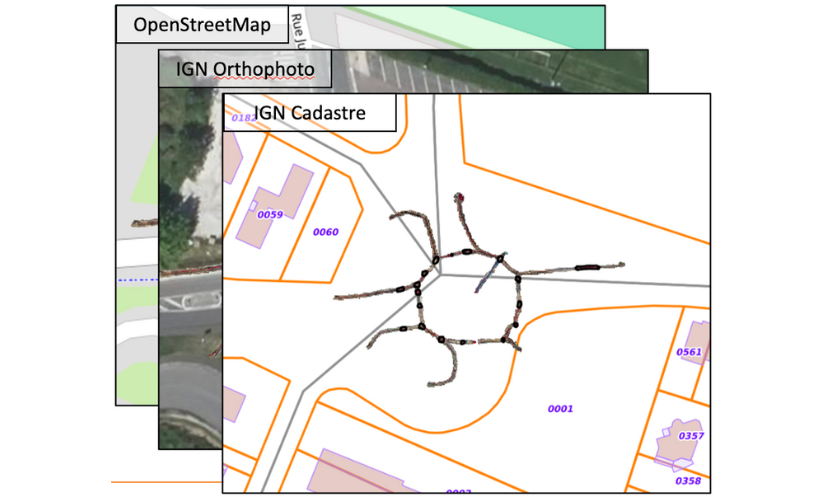
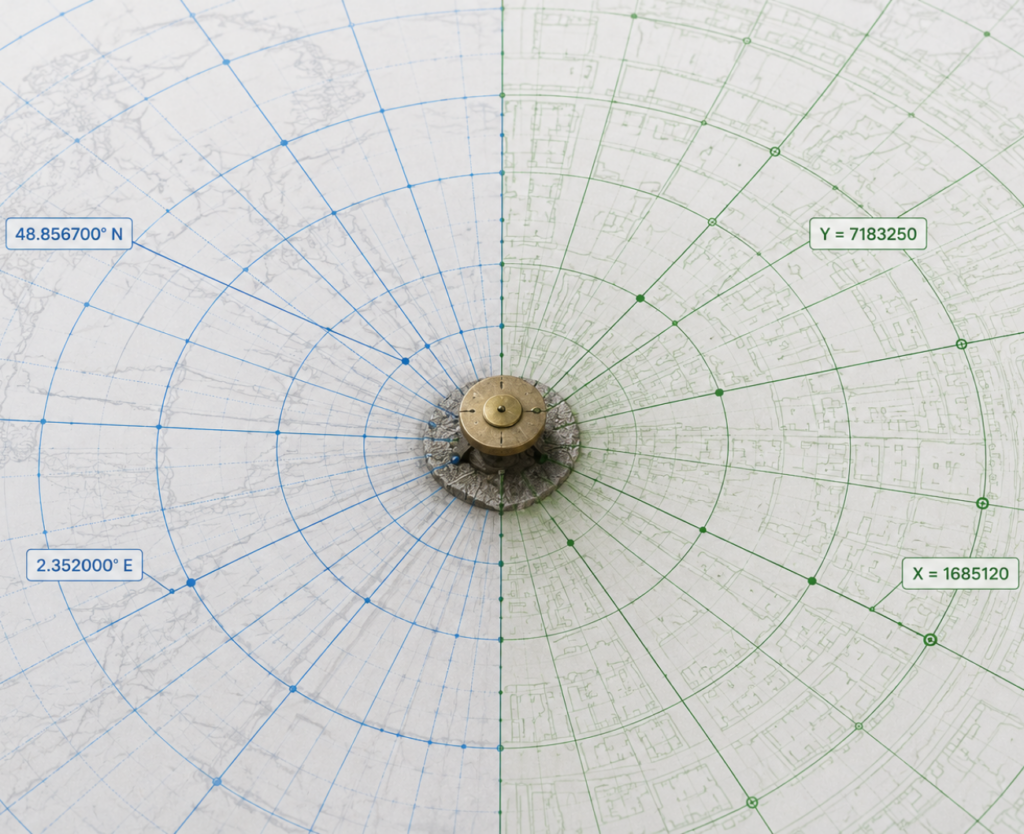
WGS84, RGF93, Lambert-93… understanding coordinate systems without being a GIS specialist. You have just imported a GNSS survey into your business software. The site was surveyed using an RTK receiver. The stated accuracy is centimetric. Yet when you overlay the data with the basemap, cadastral data or another survey, something does not line up. The networks appear shifted, assets no longer fall exactly where they should, and discrepancies can sometimes reach several tens of centimetres or more. In this type of situation, the first instinct is often to question the accuracy of the survey or the equipment used. However, the problem may lie elsewhere: in the way coordinates are referenced, projected, transformed or interpreted by the different software applications. This is precisely why terms such as WGS84, RGF93, Lambert-93 and EPSG codes appear so frequently in surveying, GIS and CAD software. Many professionals know that they need to select EPSG:2154 or EPSG:4326 when importing data, without always knowing what those choices imply or why an incorrect setting can be enough to shift an entire project. The purpose of this article is not to provide a course in geodesy. It is to explain, in practical terms, what actually happens between your GNSS receiver and your business software, why several coordinate systems coexist, and how to avoid the most common errors when exchanging data. In this article : Why can an accurate survey still be shifted? Understanding what a coordinate system is Why do WGS84, RGF93 and Lambert-93 appear so often? WGS84: the reference system used by GNSS RGF93: the official reference system for mainland France Lambert-93: the projection used to work on a map or plan Three systems, one production chain From field acquisition to GIS: what actually happens to your data? EPSG: those four digits everyone sees… without always knowing what they mean What does an EPSG code represent? The most commonly encountered codes Why can an EPSG error cause a shift? A good habit before every import The most common errors and how to avoid them 1. Using the wrong coordinate system when importing data 2. Confusing “defining” and “transforming” a coordinate system 3. Forgetting the coordinate system when exchanging data 4. Combining several datasets without checking their consistency 5. Assuming that a shift necessarily comes from the GNSS survey Why is this a major issue for underground utility networks? Conclusion Why can an accurate survey still be shifted? A GNSS survey carried out with an RTK receiver can provide centimetre-level accuracy. Yet when it is used in GIS or CAD software, discrepancies may appear: cadastral data that no longer overlays correctly, an as-built plan shifted relative to an orthophoto, or utility networks that do not match a previous survey campaign… These situations do not necessarily indicate a measurement error. They may result from an incorrect interpretation of the coordinate system. To position data correctly, the software must know the coordinate system in which it was produced. If this information is missing, incorrect or misinterpreted, the positioning can become inconsistent. This can result in several different situations: a project appearing several hundred kilometres away; layers that fail to overlay despite a recent survey; discrepancies of several tens of centimetres between surveys; or coordinates that appear completely different from one software application to another even though they describe exactly the same point. Coordinate systems exist precisely to guarantee this consistency. Before understanding the role of WGS84, RGF93 or Lambert-93, we first need to answer a more fundamental question: what is a coordinate system, and why is it essential? Understanding what a coordinate system is A coordinate only has meaning if the system in which it is expressed is known. Let us take a simple example. The values 658 742 and 6 861 315 may precisely identify a point in mainland France… or mean nothing at all. Without additional information, it is impossible to know what these numbers represent. For a coordinate to be interpreted correctly, two elements are essential: a geodetic reference system, which defines how the Earth is represented and how a point is positioned on its surface; a map projection, which makes it possible to represent this curved surface on a flat plane in order to produce maps, plans or data that can be used in business software. These two concepts are often confused, even though they serve different purposes. The reference system answers a first question: “Where exactly is this point located on Earth?” The projection then answers a second question: “How can this position be represented on a flat plane while limiting distortion?” Illustration: IGN — Geodesy. This distinction is fundamental. A single physical point has only one actual position, but it can be expressed using different reference systems and projections. The numerical values displayed in software may therefore differ even though the geographic position remains exactly the same. This is precisely why the same survey may appear to “change coordinates” when imported into another software application. In reality, it is not the position that changes, but the way its coordinates are expressed. Understanding this principle helps avoid a common mistake: assuming that two different sets of coordinates necessarily correspond to two different positions. In many cases, they simply describe the same point in two different systems. This is where the systems most commonly encountered in France come into play: WGS84, RGF93 (aligned with the European ETRS89 reference system) and Lambert-93. Why do WGS84, RGF93 and Lambert-93 appear so often? If you regularly use a GNSS receiver, GIS software or CAD software, you have probably already encountered the names WGS84, RGF93 and Lambert-93. They are often mentioned together and sometimes even treated as interchangeable. In reality, they meet different needs and come into play at different stages of the geographic data processing chain. WGS84: the reference system used by GNSS When a GNSS receiver calculates a position from satellite signals, that position is determined within a global geocentric reference system. The best known is WGS84 (World Geodetic System 1984), used by GPS and widely adopted as

Why do your coordinates change from one software program to another? Read Post »

Notes géoréférencées - EasyView - Marquage-piquetage réalité augmentée - Syslor

Geolocated Site Notes: How to Enrich and Centralize Your Field Observations 

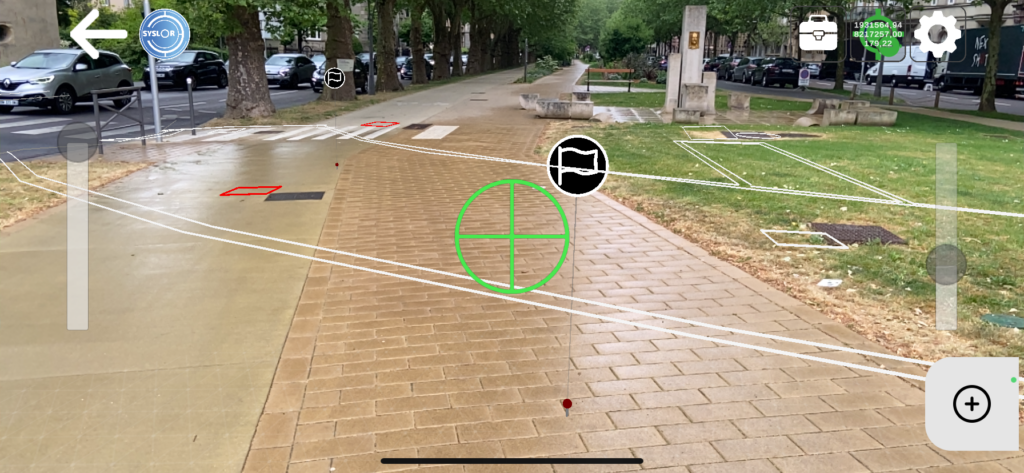
On a construction site, between an anomaly identified during excavation, a network connection to document, and an observation to report back to the office, field information often circulates poorly. Messaging apps, non-geolocated photos, paper notes: the risk of data loss or errors is real, and re-entering information in the office is time-consuming.  For Public Works stakeholders, the challenge is even greater: maintaining comprehensive and up-to-date documentation of their infrastructure is now essential, both to optimize project monitoring and to comply with regulations on the prevention of damage to underground networks.  EasyView now integrates a module for geolocated site notes to address this challenge — and contribute to better-documented networks with every intervention.  EasyView, Syslor’s Augmented Reality App for the Field EasyView is Syslor’s mobile application designed to visualize underground networks in augmented reality and achieve centimeter-level accuracy in RTK conditions, thanks to its connection with the Syslor GNSS receiver.  It allows field teams to load a network plan, overlay it onto the real-world view via a smartphone or tablet camera, and perform marking and staking operations with automatic generation of marking reports.  Geolocated Site Notes: How It Works EasyView users can now create notes directly from the map or from the augmented reality view. Each field note includes three components:  A free-text comment — observation, anomaly report, team instruction, as-built remark A photo — captured at the time of entry or imported from the gallery GNSS position — automatically recorded from the receiver at the time of entry Step 1: Blank form for creating a georeferenced note Step 2: Add a photo to the georeferenced note Step 3: Display of GNSS coordinates Notes are displayed as markers directly on the map and in the augmented reality view. The content of each note (comment and photo) can be accessed at any time from EasyView, both in plan view and augmented reality molde, as well as from the EasyDesk web portal. Here’s what the feature looks like in the EasyView app: Note markers – plan view Note marker – augmented reality view Visible note – augmented reality view On the web portal side (EasyDesk): Georeferenced note markers – plan view List of georeferenced notes for a project Real-World Use Cases on Site This feature addresses several operational needs across different field scenarios:  Identification and Reporting of Anomalies As soon as a non-compliance is identified — structural defect, deviation from plans, or damage — the operator creates a note on site, including a photo and precise location. The information is instantly available on the portal, with no delay or data loss. Pre-Project Phase During initial site inspections, observations collected in EasyView are directly integrated into the project. The engineering office receives a geolocated field report immediately after the visit, without any need for re-entry. Execution Monitoring Project managers can document progress site by site, build a geolocated history of inspections, and share this information in real time with office teams. Discovery of an Unknown Network When an unreferenced network is uncovered during construction, work is paused to assess the situation. Depending on the context, geolocated notes play a key role: in case of impact, they provide documentation for the joint damage report; if the network is inactive, they allow the discovery to be documented without necessarily halting project progress.  Automatic Centralization in the EasyDesk Portal All notes created in the field are synchronized with the corresponding project in the EasyDesk portal. All stakeholders with access to the project — surveyors, site managers, project managers — can view the notes directly from the portal map, with no file transfer or intermediate steps required.  Available Now Included in the latest EasyView update on iOS and Android, the geolocated site notes module is now available to all users. Contact us via the contact form. Want to see the feature in action? Request a demo. Prefer to reach out directly: contact@syslor.net

Geolocated Site Notes: How to Enrich and Centralize Your Field Observations  Read Post »

EasyField evolves: new features to enhance accuracy and productivity

EasyField evolves to improve field productivity On public works sites and in underground utility network management, time pressure continues to increase. Field teams must deliver results faster while ensuring impeccable data quality. As part of its continuous improvement approach, EasyField introduces new features focused on two key operational priorities: accelerating data capture and strengthening dimensional control directly in the field. These enhancements are based on user feedback and real-world site usage. Point surveying now available in 1 second Speed is one of the most frequently expressed needs from field teams. On some projects, a large number of points must be surveyed, and every second counts. EasyField now offers two capture modes. Two capture modes adapted to site constraints A 1-second fast mode significantly accelerates surveying operations, particularly on linear networks or large-scale construction sites. It improves workflow fluidity and reduces overall time spent on site. A 5-second standard mode remains available when environmental conditions require longer GNSS signal stabilization or when the user prefers additional measurement consolidation. This flexibility allows fast surveying to be adapted to real site conditions without increasing operational complexity. New real-time measurement and dimensioning features Beyond measurement speed, the application update strengthens geometric control directly from the smartphone, with two new features: Linear dimensioning (both partial — segment by segment — and total or cumulative line length) Area dimensioning (automatic calculation of the surface area enclosed within the geometry) Dynamic display of segment distances When creating a polyline, EasyField displays in real time the distance between the last surveyed point and the vertex currently being positioned. The operator instantly sees the length of the active segment, while partial distances of all existing segments are also displayed, providing complete and precise tracking of the polyline with each new capture. This real-time visualization allows immediate adjustment of vertex spacing and helps avoid corrections after export. Cette visualisation en temps réel permet d’ajuster immédiatement l’espacement des sommets d’un tracé et d’éviter les corrections après export. Automatic calculation of total polyline length Once the polyline is completed, the cumulative length is automatically calculated and displayed within the application. Users can immediately verify measurement consistency before validation. Instant surface calculation for area surveys For area surveys, the surface is automatically calculated as soon as the polyline is closed. This feature simplifies the control of site boundaries, earthwork zones, and operational perimeters directly in the field. Data is no longer merely captured — it is validated at the very moment it is produced. Convert a polyline into a surface Close a polyline to display the surface area value A direct impact on field-to-office workflow efficiency These enhancements deliver tangible operational benefits: 1-second surveying reduces time spent on site Dynamic measurement secures dimensional accuracy Immediate validation limits office rework The result is a more fluid production chain, where data circulates faster and with less uncertainty between field operators, site managers, and design offices. These new features integrate seamlessly into the EasyField ecosystem These capabilities complement the functionalities already available within the application. To discover the full EasyField workflow for stakeout and topographic surveying, explore our detailed solution overview. EasyField also relies on high GNSS accuracy—particularly through our Proteus receiver—to ensure the reliability of field measurements. This update is part of an ongoing commitment to improving site productivity while securing the quality of georeferenced data. Try the new EasyField features The update is available on iOS and Android. To discover 1-second surveying and the new real-time measurement features in action, schedule a demonstration with our team and evaluate how they integrate into your workflow.

EasyField evolves: new features to enhance accuracy and productivity Read Post »

EasyField: the all-in-one solution for staking, topographic surveying, and earthworks

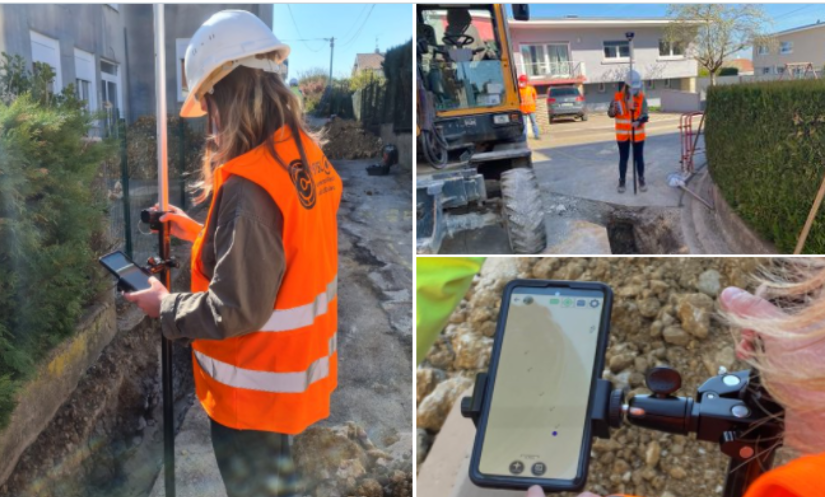
Field operations are facing increasing requirements in terms of reliability, responsiveness, and data quality. For network operators and public works companies, it has become essential to rely on tools that reduce rework, secure field operations, and streamline exchanges between the jobsite and the office. EasyField addresses these challenges by turning a smartphone or tablet into a practical surveying tool tailored to field use. The application covers staking, topographic surveying, and earthworks control within a single mobile environment. EasyField, a mobile surveying application focused on simplicity and accuracy Designed for everyday geospatial operations, EasyField combines: centimeter-level GNSS accuracy, an intuitive interface, a smooth workflow, compatibility with CAD formats (DXF, DWG) as well as point list formats (CSV, TXT, XLSX, ODS). From an iOS or Android smartphone or tablet, plans can be viewed directly in the field, operations are guided step by step, and topographic data is captured and verified throughout the intervention. The goal is to reduce time spent on site while ensuring the reliability of the data produced. Staking: fast and plan-compliant field execution Site staking plays a key role in the success of a project: it ensures the accurate transfer of execution plans to the field by guaranteeing precise positioning of structures, and helps prevent construction errors or delays caused by rework. As a critical phase, it requires reliable tools that can be quickly deployed on site. Turning a digital plan into an operational guide EasyField allows you to import your plans in DXF and DWG formats and view your elements (points, lines, areas) directly on mobile. The application then provides real-time guidance, including: distance indication, direction to follow, confirmation upon arrival. Benefits for field teams With EasyField, staking becomes an accessible operation, even without advanced surveying expertise: Faster staking Greater autonomy for field teams Access to always up-to-date georeferenced data Reduced travel and rework Less reliance on subcontractors Topographic survey: capturing field reality in just seconds Topographic surveys are essential for updating underground networks, documenting project progress, or preparing future works. Simplified topographic surveying EasyField allows you to capture: points, polylines, circles and arcs, surfaces. Each measurement is recorded with a level of accuracy suited to your operational requirements and can be exported in DXF or DWG for immediate integration. Quality validation at the point of capture Survey quality is checked at the moment of capture, allowing measurements to be validated immediately and avoiding any later rework. The application continuously displays: GNSS information, expected accuracy. Result: a survey validated on the first attempt, with no rework required. Earthworks: immediate control and optimization of earth movements Earthworks often represent a significant portion of a project’s budget. Poor cut-and-fill estimation can lead to major cost overruns. Project surface analysis EasyField allows you to import your DTMs (Digital Terrain Models) to compare: existing terrain, proposed terrain. Identify areas to be corrected at a glance The application automatically displays: cut areas, fill areas, surface areas, elevation differences. This allows adjustment decisions to be made immediately, based on reliable data. Who is EasyField for? EasyField is designed to meet the needs of different stakeholders facing the same challenges: saving time, improving the reliability of field operations, reducing errors, and streamlining data flow between the field and the office. Here’s how the application adapts to each user profile. Surveyors: remote supervision, validation, and reduced travel For surveyors, one of the main challenges is the frequent back-and-forth between the field and the office, as well as data transfer between teams. The value of EasyField truly comes into play when used with the Syslor platform, which centralizes plans, synchronizes surveys, and ensures data consistency between the design office and the jobsite. This office ↔ field workflow guarantees controlled production and greater operator autonomy. With the application, surveyors can: prepare staking plans in the office and instantly send them to field teams, retrieve surveys without traveling to the site, review data immediately after it is generated, focus their time on truly critical operations. EasyField becomes an operational support tool, allowing surveyors to work more efficiently while maintaining full technical control over their data. Underground network operators and asset managers: ensuring reliable cartographic updates For underground network operators and asset managers (water, electricity, telecom, gas, wastewater), keeping cartographic data up to date is essential to improve: safety, network maintenance, asset knowledge, regulatory compliance. Teams have access to georeferenced surveys that can be immediately integrated into GIS or CAD systems. On site, you can: accurately survey installed networks, document each asset in real time, reduce cartographic update delays, limit the risks of mislocation or uncertainty. Information becomes reliable, standardized, and immediately integrable into the network asset database. Field operators: a guided and intuitive interface Not all field operators are trained in surveying. EasyField is designed with them in mind, with an interface that makes every action easy to understand. The application simplifies: onboarding in just a few minutes, viewing plans directly on mobile, visual guidance for staking and surveying, real-time validation of captured points, automated data export. No surveying expertise is required: the tool builds confidence for field teams and ensures reliable results from the first attempt. Why choose EasyField ? EasyField fits into a structured approach to field operations by combining data reliability, ease of use, and interoperability with existing tools. Certified GNSS accuracy tailored for public works EasyField works with our Proteus GNSS receiver as well as Emlid Reach RS2 and Teria Pyx GNSS receivers, ensuring centimeter-level accuracy essential for: staking, topographic surveying, earthworks control, network updates. Measurement quality is displayed directly in the application, allowing data to be validated at the moment of capture, with no risk of error. Reliable data from the start means less rework, less uncertainty, and lower costs. Unmatched ease of use EasyField is designed to be used by any team member, even without surveying experience.The application is built around: clear visual guidance, consistent workflows. This simplicity significantly reduces: handling errors, training requirements, dependence on technical experts. Your smartphone becomes a professional tool that is immediately operational. Time savings and cost

EasyField: the all-in-one solution for staking, topographic surveying, and earthworks Read Post »

How Merging Orthophotos and Point Clouds Enhances Project Accuracy

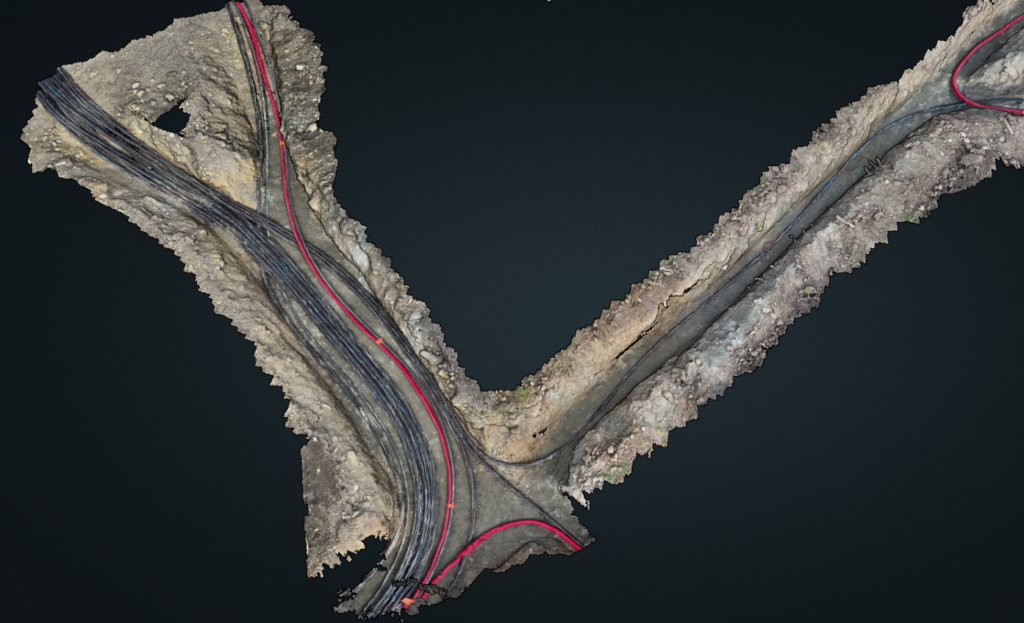
On construction sites, each photogrammetric survey generates its own dataset — an orthophoto, a point cloud, sometimes dozens of separate files to manage. Over time, these fragmented deliverables become difficult to work with. Misaligned joins, overlapping zones, or missing areas can compromise the overall topographic consistency of the project. For surveyors, engineering offices, and project managers, the issue is often the same: getting a comprehensive and accurate view of the site requires time-consuming manual work, which increases the risk of errors. This is exactly the challenge addressed by the merging of orthophotos and point clouds.By bringing all survey data together into a single, unified, georeferenced model, this process delivers a continuous, coherent, and readily exploitable view of the project. Beyond improving readability, accuracy, and efficiency across the entire production chain, it also saves a significant amount of time for survey teams when preparing their deliverables. To better understand its advantages, let’s start by defining what the merging of orthophotos and point clouds actually is. What Does Merging Involve? Merging consists of combining several separate orthophotos or point clouds into a single, unified, and consistent view, while preserving the original centimetric accuracy and georeferencing.Each area captured during the photogrammetric survey is repositioned within the same coordinate system to create a continuous mosaic of the project. The merging process relies on rigorous management of metadata and spatial coordinates. This ensures that all datasets align perfectly — without offset, elevation gaps, or quality loss. The result is a unified model that faithfully represents the entire site, enabling consistent and accurate measurements across the whole area. With this merging process in place, it becomes possible to visualize, measure, and vectorize an entire project from a single unified dataset, regardless of the project’s size or complexity. Now that the concept of merging is clear, let’s look at how it concretely improves the production and use of photogrammetric deliverables. Why Merge Your Photogrammetric Deliverables? Merging is not just a simple file combination — it’s a key step that allows teams to fully leverage the richness of photogrammetric data while ensuring the consistency of all deliverables.Here are the main advantages it brings, both in the field and in the office. Gain a Global View of the Project and In-Situ Context Merging provides a comprehensive view of the construction site, restoring the entire area within a single, continuous representation.It makes it possible to place each work zone within its broader environment — a valuable advantage for large-scale sites or linear projects such as roads, utilities, or railway corridors. This unified view helps teams understand how different areas interact, for example between the construction footprint, the surrounding environment, and existing underground or above-ground networks. Improve Vectorization Accuracy and Spatial Consistency By merging several orthophotos or point clouds within the same reference system, merging eliminates alignment errors between deliverables.It ensures a homogeneous topographic continuity, which is essential for: the precise vectorization of utility networks, the production of reliable as-built plans, and volume or surface calculations. Each measurement is therefore based on a coherent, georeferenced dataset, with no risk of misalignment between areas. Simplify the Use of Your Deliverables Through Centralized Data With merging, there’s no need to juggle multiple files anymore.Orthophotos and point clouds are grouped into a single unified view, speeding up processing and reducing the risk of errors during plan production or verification. This approach also simplifies importing deliverables into standard GIS or CAD software (DGN, DXF, CSV): a single, complete, georeferenced file, immediately ready for use by all project stakeholders. Enhance Collaborative Work By providing a single, consistent source of truth, merging makes collaborative work much easier.Everyone works from the same reference dataset, improving both validation and quality control of deliverables throughout the entire project lifecycle. Looking Ahead: Tracking Project Progress Over Time In the long term, merging opens the door to new possibilities: tracking the evolution of a construction site over time, overlaying successive surveys (before and after works), and building a true digital twin of the project. This approach will make it possible to accurately analyze site transformations — from earthworks to network installation — and to ensure complete traceability of all operations. How Syslor Facilitates the Merging of Orthophotos and Point Clouds The merging of orthophotos and point clouds truly reveals its value when it’s part of a seamless workflow — from data capture in the field to data processing and analysis. This is exactly what Syslor offers through two complementary solutions: EasyScan for photogrammetric surveying, and EasyMap for the visualization and processing of deliverables. EasyScan – Accurate and Standardized Photogrammetric Capture Everything starts in the field with EasyScan, the solution designed to perform georeferenced photogrammetric surveys. Each survey performed with the EasyScan application ensures centimetric accuracy and structured, standardized data.As a result, right from the survey phase: orthophotos and point clouds are perfectly aligned within the same reference system; deliverables are immediately available in EasyMap for further processing and analysis. EasyMap – Merging and Centralized Management of Deliverables Once the surveys are completed, EasyMap (formerly Sysmap) takes over. The tool, available directly through the Syslor web portal, assembles orthophotos and point clouds from different photogrammetric surveys to generate a unified overview of the entire project. The user then gains access to a comprehensive environment to: visualize the construction site as a whole, vectorize networks on a consistent base, perform measurements and volume calculations without discontinuities, and export reliable as-built plans with full confidence. This automation ensures a smooth, continuous production workflow, from field survey to final deliverable delivery. Ready-to-Use and Interoperable Deliverables Thanks to the complementarity between EasyScan and EasyMap, all data is aligned, merged, and immediately usable across any working environment — CAD, GIS, or collaborative platforms.The result: greater accuracy, less post-processing, and improved traceability throughout the entire project lifecycle. Want to learn more? Request a demo. A Unified Vision for More Accurate and Actionable Deliverables The merging of orthophotos and point clouds is not just a technical step — it’s a key requirement for ensuring the reliability and readability of

How Merging Orthophotos and Point Clouds Enhances Project Accuracy Read Post »

EasyMap News - October 2025

Customized Attribute Libraries, 3D Editing, and Model Concatenation: What’s New at Syslor? 

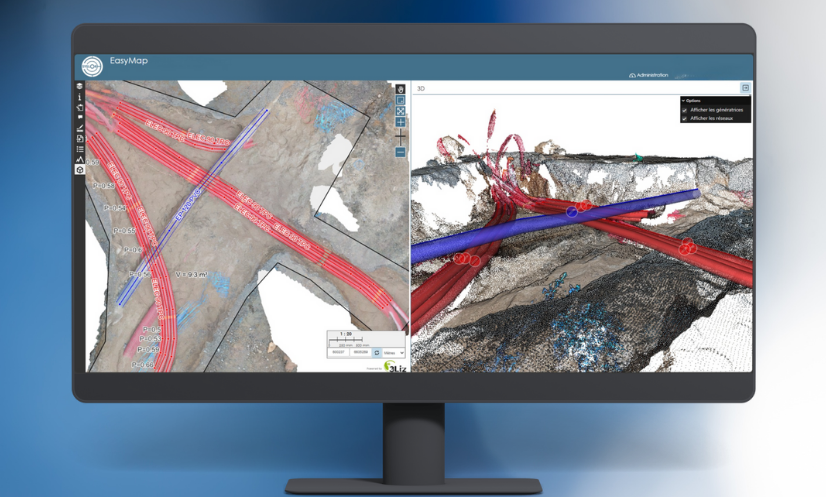
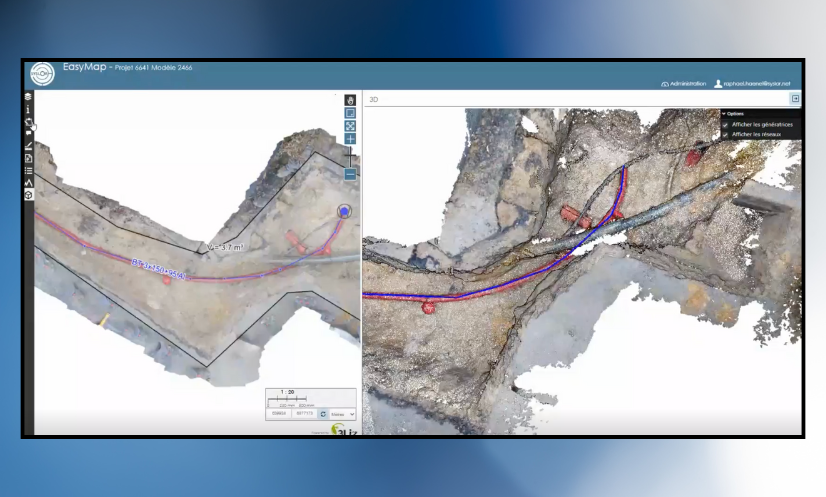
Syslor is enhancing its EasyMap platform with three new features that make daily operations even smoother for field and design teams. EasyMap is the drawing and tracing tool accessible directly from the Syslor portal, used by EasyScan users to edit orthophotos and point clouds generated from photogrammetric surveys. It enables users to transform survey data into usable plans, control altimetry, and monitor project progress.  The new features focus on three key aspects:  Customizable vectorization,  The move from 2.5D to full 3D,  Model concatenation for an overall project view.  All these improvements share a common goal: simplify deliverable production, increase accuracy, and ensure better continuity between all project stakeholders.  Customize Vectorization to Match Your Standards Attribute Libraries Tailored to Your Needs Every company applies its own mapping standards. EasyMap now includes customizable attribute libraries, grouping the necessary object families (electricity, water, heating, telecom, wastewater, etc.) in line with your internal practices. Ready-to-Use, Standards-Compliant Exports Generated plans automatically comply with your nomenclatures and export formats (DXF, DGN, etc.). No more manual adjustments — exports from EasyMap are structured, standardized, and complete, saving time and reducing the risk of error.  Control and Edit in 3D While Keeping the Simplicity of 2.5D The Limits of 2.5D 2.5D remains widely used because it’s lightweight and easy to handle. However, it reaches its limits when verifying altimetry or working with overlapping networks. On the other hand, navigating within a 3D view allows for continuous control, but it is less intuitive and straightforward due to the complexity of three dimensions. Dual View for Greater Precision EasyMap now offers a dual view: a classic 2.5D view on the orthophoto to maintain the simplicity of tracing, a 3D view of the point cloud to verify altimetric consistency and interact directly with objects. Thanks to this combination, it is now possible to: draw networks on the orthophoto while simultaneously checking the accuracy and diameters within the point cloud, edit in 3D, allowing users to trace networks or modify a point directly in the point cloud and instantly visualize the impact on the orthophoto. This interaction between the point cloud and the orthophoto greatly enhances the accuracy of as-built documentation. Concatenate Models for a Complete Project Overview Global Project Management and Tracking Model concatenation automatically groups multiple photogrammetric surveys into coherent zones. This provides not only a macro view of the project but also continuous monitoring of its progress. This global approach facilitates project management, team coordination, and the progressive updating of data throughout the project. Global statistics (lengths, network types, progress rates) offer a clear and centralized overview. The choice of the background map allows for better contextualization of the project. Continuity and Unified Export Overlapping areas are automatically flagged as attention points. A dedicated process ensures topological continuity between models, reducing connection errors and ensuring smooth, uninterrupted tracing. The entire project can then be exported as a single, consistent file in all standard industry formats. Result: a single, fast, and consistent export, directly usable in standard industry formats (CSV, DXF, DGN, etc.), with no manual post-processing required. A Step Toward Greater Automation These new features already simplify users’ daily workflows by reducing manual corrections and improving coordination. They also mark the next step in Syslor’s broader roadmap: 3D tracing, AI-assisted drawing, and georeferenced annotations will soon further enrich the EasyMap experience.

Customized Attribute Libraries, 3D Editing, and Model Concatenation: What’s New at Syslor?  Read Post »

Photogrammetry: principles, method and use cases

What is photogrammetry? Photogrammetry is a technique for generating 3D restitution from 2D images. In practice, it makes it possible to model terrain with high precision, without contact, by exploiting the principle of parallax between several photos taken from different angles. Historically, it was first used in geomatics. Today, this method finds concrete applications in the fields of topography, public works, and network management. For its part, Syslor leverages photogrammetry using video captures made directly in the field by users via the EasyScan application, from a smartphone or tablet. These videos are then processed to produce georeferenced orthophotos and 3D models that can be used in our visualization and vectorization portal. Finally, this article outlines the basic principles of photogrammetry, its key steps, the deliverables generated, as well as its main field applications. Types of photogrammetry (analytical, digital) Depending on the evolution of techniques and available tools, photogrammetry can be implemented in different ways. Two main approaches are generally distinguished, which differ in their level of automation and the calculation methods used: Analytical photogrammetry: based on manual or semi-automated geometric calculations. Digital photogrammetry: fully computer-based, it relies on matching algorithms and image processing. How does photogrammetry work? Beyond its theoretical principle, photogrammetry relies on a well-structured processing workflow that transforms simple images into usable geometric data. From the automatic identification of common points to the generation of orthophotos and 3D models, each step contributes to ensuring the precision and consistency of the final result. Here are the main stages of this process: Matching of homologous points The software automatically identifies identical points (tie points) present in multiple images, usually by using correlation methods or feature detection. In practice, this avoids the need for the operator to manually capture every detail and ensures a solid foundation for reconstructing the site in 3D. Parallax and triangulation in photogrammetry The difference in angle between images makes it possible to calculate the 3D position of each point through triangulation. This mathematical process results in an accurate 3D model of the trench or surveyed surface, which can then be directly used to measure distances, depths, or verify the location of utilities. Image overlap conditions (forward and side overlap) To obtain a coherent and complete model, it is necessary to ensure: A forward overlap of at least 70% between two consecutive images, A side overlap of at least 30% between two flight lines. In practice, this means that operators must capture photos or videos in a regular and structured way, ensuring that the software can accurately reconstruct every part of the site without missing areas. Steps of the photogrammetry processing workflow Image alignment: recognition of common points and relative orientation. Generation of the 3D point cloud: dense, structured, and accurate. Production of the DTM/DSM: extraction of topographic surfaces. Orthophotography: planar, distortion-free, and georeferenced projection. Data export: standard formats for GIS/CAD integration. Photogrammetry deliverables: what results can you obtain? Orthophoto A georeferenced image in planar projection, free from distortion, that can be used as a base map for layouts or surveys. It is the equivalent of a “photo plan” of the construction site, serving as a reliable background for mapping utilities and producing a compliant as-built record. Digital Surface Model (DSM) and Digital Terrain Model (DTM) DSM (Digital Surface Model): includes visible surface objects (vegetation, buildings). DTM (Digital Terrain Model): represents only the bare ground surface, without obstacles. Photogrammetric 3D point cloud Resulting from triangulation, it enables the detailed reconstruction of terrain, structures, and volumes. For the user, this is equivalent to having a digital copy of the site, which can be revisited at any time to perform measurements or provide evidence of the work carried out. Export to GIS / CAD formats The data can be exported in standard formats (.tif, .las, .dxf, .shp, .gml, etc.) for integration into CAD or GIS software. Photogrammetry in the field: what is it used for? Photogrammetry is particularly useful for: Large-scale surface surveys, even in areas that are difficult to access. Construction site visualization, including topography, access, obstacles, and interfaces. Utility marking and as-built plans, where orthophotos allow the visual integration of surveyed networks. Vectorization within professional platforms, where the orthophoto serves as a reliable base for accurately mapping utilities, as in the Syslor interface. Applying photogrammetry to underground utility mapping and as-built documentation In the context of underground utility as-built surveys, photogrammetry provides an effective response to both regulatory and operational requirements. In practice, from videos or images taken during trench openings, it is possible to generate georeferenced orthophotos and 3D point clouds that accurately document the condition of the terrain and the position of installed utilities. Subsequently, the data are integrated into GIS, CAD, or CAE environments using standard formats (.tif, .las, .dxf, .shp, .gml), thus ensuring their usability by all project stakeholders. When combined with centimetric GNSS positioning (RTK/NRTK) or ground control points (GCPs), this method guarantees absolute accuracy in line with as-built requirements. The benefits of photogrammetry in this context are multiple: Damage evidence: the orthophoto serves as an objective record in the event of damage to utilities or incidents related to construction work. Traceability and history: each intervention is documented and archived, providing a reliable basis for monitoring utilities. Damage prevention: accurate knowledge of the subsurface and existing utilities reduces risks during future operations. Asset management: the generated data enrich cartographic databases and facilitate the long-term management of infrastructures. Ultimately, by combining photogrammetry with centimetric GNSS measurements, it becomes possible to produce an as-built survey that is exhaustive, accurate, and reliable as a reference in the event of inspections or disputes. This approach effectively addresses safety, regulatory compliance, and cost-control challenges related to damages. With EasyScan, operators simply record the trench using a smartphone. The videos are automatically transformed into georeferenced orthophotos and accurate 3D models, which are then integrated into the Syslor portal for vectorization. Combined with the centimetric GNSS receiver Proteus, the solution ensures a reliable as-built survey that is immediately usable by all project stakeholders. In summary Photogrammetry is a

Photogrammetry: principles, method and use cases Read Post »

GNSS positioning

GNSS – Understanding the Foundations of Satellite Positioning

GNSS positioning is used in many professional applications, including surveying, civil engineering, and utility network management. It relies on satellite constellations and complex calculation methods to determine an accurate position. Here’s a breakdown of how GNSS systems work and the common causes of accuracy degradation. GNSS: Beyond GPS The term “GPS” is often mistakenly used to refer to all satellite positioning technologies. In reality, GPS is just one of the available systems. The correct term is GNSS (Global Navigation Satellite System), which encompasses all active satellite constellations: GPS (USA) GLONASS (Russia) GALILEO (European Union) BEIDOU (China) Some regions also benefit from complementary regional systems, such as QZSS in Japan. Principles of Position Calculation A GNSS receiver calculates its position based on the measured distance between itself and several satellites. Each satellite continuously broadcasts a signal containing precise time information. By measuring the time it takes for the signal to reach the receiver, the distance can be determined. This process is known as trilateration. To compute a full position (latitude, longitude, altitude) and correct the receiver’s clock bias, at least four satellites are required. Using multiple constellations increases the number of visible satellites, thereby improving the accuracy and reliability of the positioning. Contents of GNSS Signals Each satellite transmits a signal composed of several elements. These signal structures are defined in the official GPS system specification, IS-GPS-200, published by the United States Department of Defense: Navigation data: includes orbital parameters and clock corrections. What are ephemeris data used for? Ephemeris data are orbital parameters transmitted by each GNSS satellite within its navigation messages. They describe the satellite’s trajectory over a given period and are essential for the receiver to compute the satellite’s exact position at the time the signal was transmitted. There are two main types: Broadcast ephemeris, calculated by GNSS control centers and transmitted in real time within the satellite signals. Precise ephemeris, produced by organizations such as the IGS (International GNSS Service), used in applications requiring high accuracy, especially for post-processing. An error in the ephemeris data can result in positioning errors of several meters. Their quality is therefore a critical factor in any precise GNSS computation. Precise ephemerides are particularly provided by institutions like the IGS, which supplies reference orbital and timing data used in PPP (Precise Point Positioning) solutions. Pseudo-Random Noise (PRN) code: allows identification of the satellite and calculation of the signal travel time. Carrier wave: a radio-frequency signal that carries the other data. The satellite–receiver distance can be calculated in two ways: Using the PRN code, with meter-level accuracy. Using the carrier phase, which provides centimeter-level accuracy, but requires complex processing to resolve ambiguities (such as cycle slips and the integer number of cycles). Understanding Carrier Phase Ambiguity Measuring the phase of a carrier wave allows for much higher accuracy than code-based positioning. However, it comes with a particular challenge: the receiver can measure the received phase, but does not know the exact number of whole cycles traveled between the satellite and itself. This is known as carrier phase ambiguity. To convert the measurement into an absolute distance, the ambiguity must be “resolved,” meaning the correct number of full cycles must be estimated. This step is critical in positioning techniques like RTK (Real-Time Kinematic) or PPP (Precise Point Positioning), where the accuracy directly depends on the quality of ambiguity resolution. An incorrect ambiguity “fix” results in a systematic error that can reach several centimeters or more. That’s why high-end receivers include advanced algorithms capable of detecting, modeling, and correcting these uncertainties. Ambiguity resolution is extensively documented in the literature, notably in the Springer Handbook of GNSS (Teunissen & Montenbruck, 2017), a key reference on the topic. Main Sources of GNSS Errors Several factors affect positioning accuracy. Errors may arise from: From the satellites: Clock errors: although satellites are equipped with atomic clocks, even tiny drifts can cause positioning errors of several meters. Orbital errors: discrepancies exist between the satellite’s theoretical position and its actual position. From the atmosphere: Ionospheric delay: caused by charged particles in the upper atmosphere; it varies with solar activity. Tropospheric delay: caused by humidity and pressure in the lower layers of the atmosphere. From the receiver: Internal clock drift Local environment errors: such as multipath effects, obstructions, and interference. Cycle slips: an intermittent but critical source of error A cycle slip is a sudden disruption in the tracking of a carrier phase signal by a GNSS receiver. This typically occurs when a temporary obstacle (such as a vehicle, building, or vegetation) blocks or disturbs the signal, even momentarily. When the signal is reacquired, the receiver resumes phase tracking, but the previous ambiguity is no longer valid—it must be re-estimated. If this detection is poorly handled, it can result in an invisible but long-lasting error. High-performance receivers, such as Proteus, are equipped with automatic cycle slip detection mechanisms and can restart ambiguity resolution algorithms accordingly. Effective handling of cycle slips is critical in complex environments such as urban areas, forests, or cluttered construction sites. Signal processing accuracy: depends on the quality of the hardware and the algorithms used.   Type of error Origin Order of magnitude Satellite clock drift Space segment Up to 3 meters Orbital error Space segment ±2.5 meters Ionospheric delay Atmosphere (50–1000 km) 5 to 50 meters Tropospheric delay Atmosphere (0–12 km) 2 to 10 meters Multipath Receiver / Environment Variable (meters) Internal measurement noise Receiver Centimeter to decimeter level Improving Accuracy: GNSS Corrections To achieve centimeter-level accuracy, GNSS positioning must be corrected. Several techniques exist depending on the use case and operating conditions: RTK (Real-Time Kinematic) and NRTK (Network RTK): use one or more fixed reference stations to provide real-time correction data. The differential correction data are usually transmitted in the RTCM 10403.3 format, a widely adopted standard in professional GNSS systems. Base/Rover: involves a mobile base station that sends corrections to a rover in real time. This method requires solid surveying knowledge for proper setup. PPP (Precise Point Positioning): uses mathematical models to correct various error

GNSS – Understanding the Foundations of Satellite Positioning Read Post »

Scroll to Top