Use Case

Notes géoréférencées - EasyView - Marquage-piquetage réalité augmentée - Syslor

Geolocated Site Notes: How to Enrich and Centralize Your Field Observations 

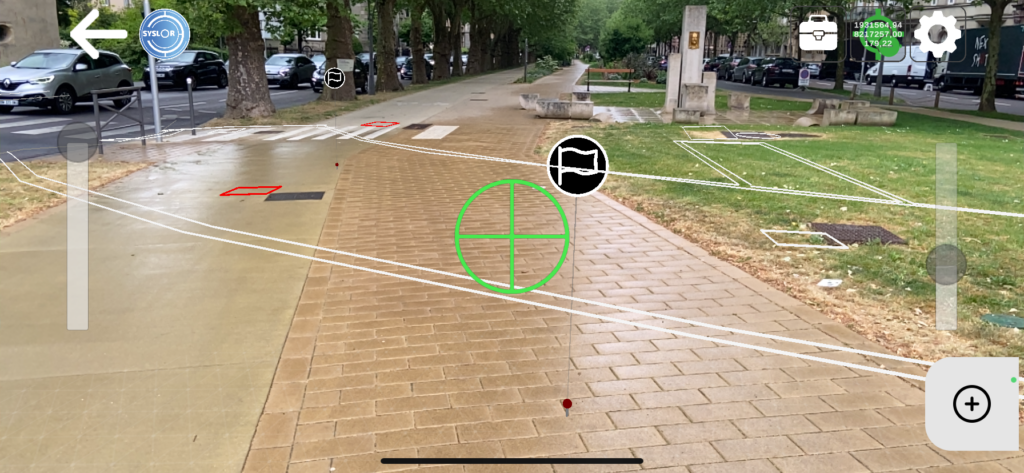
On a construction site, between an anomaly identified during excavation, a network connection to document, and an observation to report back to the office, field information often circulates poorly. Messaging apps, non-geolocated photos, paper notes: the risk of data loss or errors is real, and re-entering information in the office is time-consuming.  For Public Works stakeholders, the challenge is even greater: maintaining comprehensive and up-to-date documentation of their infrastructure is now essential, both to optimize project monitoring and to comply with regulations on the prevention of damage to underground networks.  EasyView now integrates a module for geolocated site notes to address this challenge — and contribute to better-documented networks with every intervention.  EasyView, Syslor’s Augmented Reality App for the Field EasyView is Syslor’s mobile application designed to visualize underground networks in augmented reality and achieve centimeter-level accuracy in RTK conditions, thanks to its connection with the Syslor GNSS receiver.  It allows field teams to load a network plan, overlay it onto the real-world view via a smartphone or tablet camera, and perform marking and staking operations with automatic generation of marking reports.  Geolocated Site Notes: How It Works EasyView users can now create notes directly from the map or from the augmented reality view. Each field note includes three components:  A free-text comment — observation, anomaly report, team instruction, as-built remark A photo — captured at the time of entry or imported from the gallery GNSS position — automatically recorded from the receiver at the time of entry Step 1: Blank form for creating a georeferenced note Step 2: Add a photo to the georeferenced note Step 3: Display of GNSS coordinates Notes are displayed as markers directly on the map and in the augmented reality view. The content of each note (comment and photo) can be accessed at any time from EasyView, both in plan view and augmented reality molde, as well as from the EasyDesk web portal. Here’s what the feature looks like in the EasyView app: Note markers – plan view Note marker – augmented reality view Visible note – augmented reality view On the web portal side (EasyDesk): Georeferenced note markers – plan view List of georeferenced notes for a project Real-World Use Cases on Site This feature addresses several operational needs across different field scenarios:  Identification and Reporting of Anomalies As soon as a non-compliance is identified — structural defect, deviation from plans, or damage — the operator creates a note on site, including a photo and precise location. The information is instantly available on the portal, with no delay or data loss. Pre-Project Phase During initial site inspections, observations collected in EasyView are directly integrated into the project. The engineering office receives a geolocated field report immediately after the visit, without any need for re-entry. Execution Monitoring Project managers can document progress site by site, build a geolocated history of inspections, and share this information in real time with office teams. Discovery of an Unknown Network When an unreferenced network is uncovered during construction, work is paused to assess the situation. Depending on the context, geolocated notes play a key role: in case of impact, they provide documentation for the joint damage report; if the network is inactive, they allow the discovery to be documented without necessarily halting project progress.  Automatic Centralization in the EasyDesk Portal All notes created in the field are synchronized with the corresponding project in the EasyDesk portal. All stakeholders with access to the project — surveyors, site managers, project managers — can view the notes directly from the portal map, with no file transfer or intermediate steps required.  Available Now Included in the latest EasyView update on iOS and Android, the geolocated site notes module is now available to all users. Contact us via the contact form. Want to see the feature in action? Request a demo. Prefer to reach out directly: contact@syslor.net

Geolocated Site Notes: How to Enrich and Centralize Your Field Observations  Read Post »
How Merging Orthophotos and Point Clouds Enhances Project Accuracy

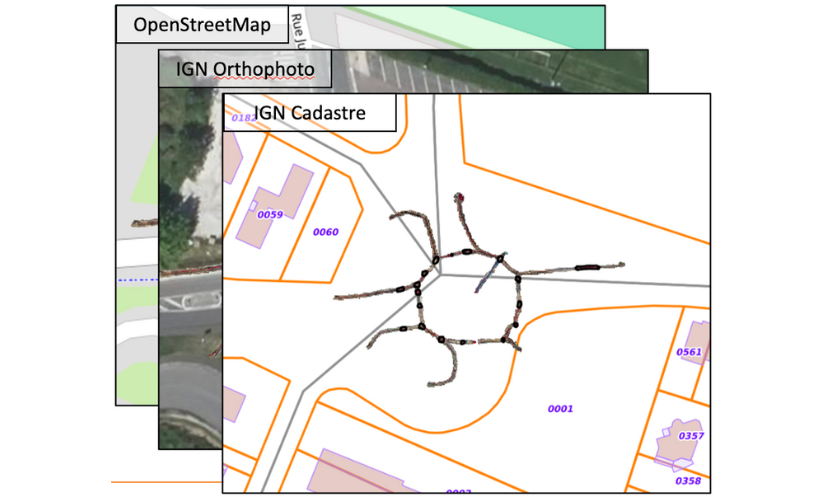
On construction sites, each photogrammetric survey generates its own dataset — an orthophoto, a point cloud, sometimes dozens of separate files to manage. Over time, these fragmented deliverables become difficult to work with. Misaligned joins, overlapping zones, or missing areas can compromise the overall topographic consistency of the project. For surveyors, engineering offices, and project managers, the issue is often the same: getting a comprehensive and accurate view of the site requires time-consuming manual work, which increases the risk of errors. This is exactly the challenge addressed by the merging of orthophotos and point clouds.By bringing all survey data together into a single, unified, georeferenced model, this process delivers a continuous, coherent, and readily exploitable view of the project. Beyond improving readability, accuracy, and efficiency across the entire production chain, it also saves a significant amount of time for survey teams when preparing their deliverables. To better understand its advantages, let’s start by defining what the merging of orthophotos and point clouds actually is. What Does Merging Involve? Merging consists of combining several separate orthophotos or point clouds into a single, unified, and consistent view, while preserving the original centimetric accuracy and georeferencing.Each area captured during the photogrammetric survey is repositioned within the same coordinate system to create a continuous mosaic of the project. The merging process relies on rigorous management of metadata and spatial coordinates. This ensures that all datasets align perfectly — without offset, elevation gaps, or quality loss. The result is a unified model that faithfully represents the entire site, enabling consistent and accurate measurements across the whole area. With this merging process in place, it becomes possible to visualize, measure, and vectorize an entire project from a single unified dataset, regardless of the project’s size or complexity. Now that the concept of merging is clear, let’s look at how it concretely improves the production and use of photogrammetric deliverables. Why Merge Your Photogrammetric Deliverables? Merging is not just a simple file combination — it’s a key step that allows teams to fully leverage the richness of photogrammetric data while ensuring the consistency of all deliverables.Here are the main advantages it brings, both in the field and in the office. Gain a Global View of the Project and In-Situ Context Merging provides a comprehensive view of the construction site, restoring the entire area within a single, continuous representation.It makes it possible to place each work zone within its broader environment — a valuable advantage for large-scale sites or linear projects such as roads, utilities, or railway corridors. This unified view helps teams understand how different areas interact, for example between the construction footprint, the surrounding environment, and existing underground or above-ground networks. Improve Vectorization Accuracy and Spatial Consistency By merging several orthophotos or point clouds within the same reference system, merging eliminates alignment errors between deliverables.It ensures a homogeneous topographic continuity, which is essential for: the precise vectorization of utility networks, the production of reliable as-built plans, and volume or surface calculations. Each measurement is therefore based on a coherent, georeferenced dataset, with no risk of misalignment between areas. Simplify the Use of Your Deliverables Through Centralized Data With merging, there’s no need to juggle multiple files anymore.Orthophotos and point clouds are grouped into a single unified view, speeding up processing and reducing the risk of errors during plan production or verification. This approach also simplifies importing deliverables into standard GIS or CAD software (DGN, DXF, CSV): a single, complete, georeferenced file, immediately ready for use by all project stakeholders. Enhance Collaborative Work By providing a single, consistent source of truth, merging makes collaborative work much easier.Everyone works from the same reference dataset, improving both validation and quality control of deliverables throughout the entire project lifecycle. Looking Ahead: Tracking Project Progress Over Time In the long term, merging opens the door to new possibilities: tracking the evolution of a construction site over time, overlaying successive surveys (before and after works), and building a true digital twin of the project. This approach will make it possible to accurately analyze site transformations — from earthworks to network installation — and to ensure complete traceability of all operations. How Syslor Facilitates the Merging of Orthophotos and Point Clouds The merging of orthophotos and point clouds truly reveals its value when it’s part of a seamless workflow — from data capture in the field to data processing and analysis. This is exactly what Syslor offers through two complementary solutions: EasyScan for photogrammetric surveying, and EasyMap for the visualization and processing of deliverables. EasyScan – Accurate and Standardized Photogrammetric Capture Everything starts in the field with EasyScan, the solution designed to perform georeferenced photogrammetric surveys. Each survey performed with the EasyScan application ensures centimetric accuracy and structured, standardized data.As a result, right from the survey phase: orthophotos and point clouds are perfectly aligned within the same reference system; deliverables are immediately available in EasyMap for further processing and analysis. EasyMap – Merging and Centralized Management of Deliverables Once the surveys are completed, EasyMap (formerly Sysmap) takes over. The tool, available directly through the Syslor web portal, assembles orthophotos and point clouds from different photogrammetric surveys to generate a unified overview of the entire project. The user then gains access to a comprehensive environment to: visualize the construction site as a whole, vectorize networks on a consistent base, perform measurements and volume calculations without discontinuities, and export reliable as-built plans with full confidence. This automation ensures a smooth, continuous production workflow, from field survey to final deliverable delivery. Ready-to-Use and Interoperable Deliverables Thanks to the complementarity between EasyScan and EasyMap, all data is aligned, merged, and immediately usable across any working environment — CAD, GIS, or collaborative platforms.The result: greater accuracy, less post-processing, and improved traceability throughout the entire project lifecycle. Want to learn more? Request a demo. A Unified Vision for More Accurate and Actionable Deliverables The merging of orthophotos and point clouds is not just a technical step — it’s a key requirement for ensuring the reliability and readability of

How Merging Orthophotos and Point Clouds Enhances Project Accuracy Read Post »

How to process and exploit point clouds effectively?

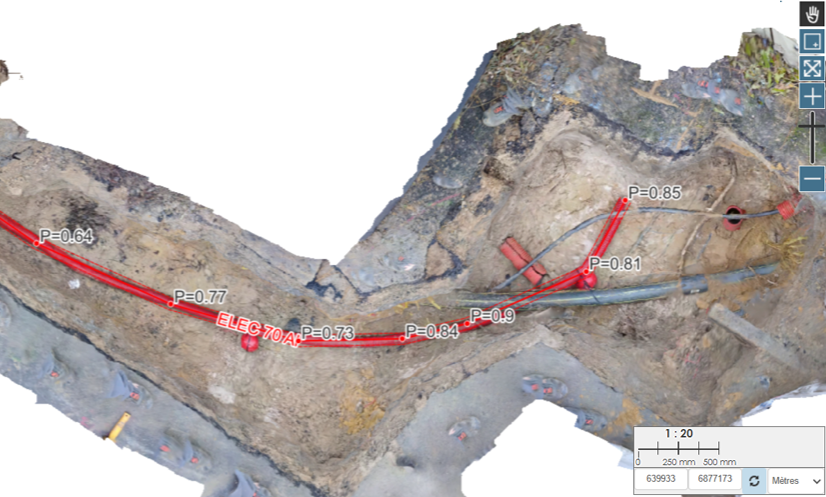
Photogrammetry has become an essential technique for documenting and analyzing construction sites, particularly in the context of as-built surveys of underground networks.It enables the production of georeferenced deliverables in various forms, such as point clouds, orthophotos, digital terrain models (DTMs), or even 3D meshes. Photogrammetric deliverables can be difficult to leverage due to the complexity of the data and the analyses required.Fortunately, some software tools—such as EASYMAP®—accessible through our web portal, greatly simplify this process, making these deliverables far more accessible to non-expert users. Let’s explore the practical applications of data collected using as-built tools like EasyScan®. Solutions for leveraging data collected through as-built surveys Vector mapping of utility networks Combining orthophotography with a digital terrain model (DTM) enables vertical projection, making it easy, fast, and accurate to vectorize the upper generatrices in 3D. This vectorization can be exported in various formats, allowing it to be used and integrated into Geographic Information Systems (GIS) or Computer-Aided Design (CAD) software, ensuring smooth interoperability between all project stakeholders. Example of upper generatrix tracing of an electrical network using Sysmap Handling longitudinal and cross-sectional profiles This vectorization comes with the ability to generate longitudinal and cross-sectional profiles, enabling continuous control of the tracing process. This ensures tracing reliability that meets the accuracy requirements of Class A. Profiles based on an electrical duct Longitudinal profile Cross-sectional profile Profiles produced with Sysmap Area measurement and cut/fill volume computation The drawing interface allows users to measure the surface areas of intervention zones, making it possible to directly assess excavated areas and optimize land use.This surface also serves as the basis for precise volumetric measurements.The Sysmap solution helps optimize earthwork costs by providing accurate resource estimates and ensuring project compliance. Area and volume computations using Sysmap Depth measurement of utility networks During network as-built surveys, photogrammetric deliverables make it possible to determine the depth of vectorized vertices from a reference surface — a crucial element for: Ensuring compliance with safety and utility location standards; Improving the quality of as-built plans by providing accurate data on pipeline burial depths. Detection of unusual depth values using Sysmap Photogrammetric deliverables go far beyond simple visualization: they enable the extraction of numerous precise measurements—vectorization, surface area, volume, depth—making them true decision-support tools for site managers and agency directors.They enhance as-built survey accuracy, optimize costs, and contribute to better management of underground infrastructure. With Sysmap—our tracing module designed to leverage photogrammetric deliverables—network tracing is performed with precision.This process ensures reliable, usable data that is essential for future projects: building asset records, reducing damage to infrastructure, saving time, and optimizing upcoming interventions. By combining high-quality surveys with dedicated tools like Sysmap, photogrammetric deliverables become true management assets—enabling more efficient and better-anticipated construction projects.

How to process and exploit point clouds effectively? Read Post »

Scroll to Top